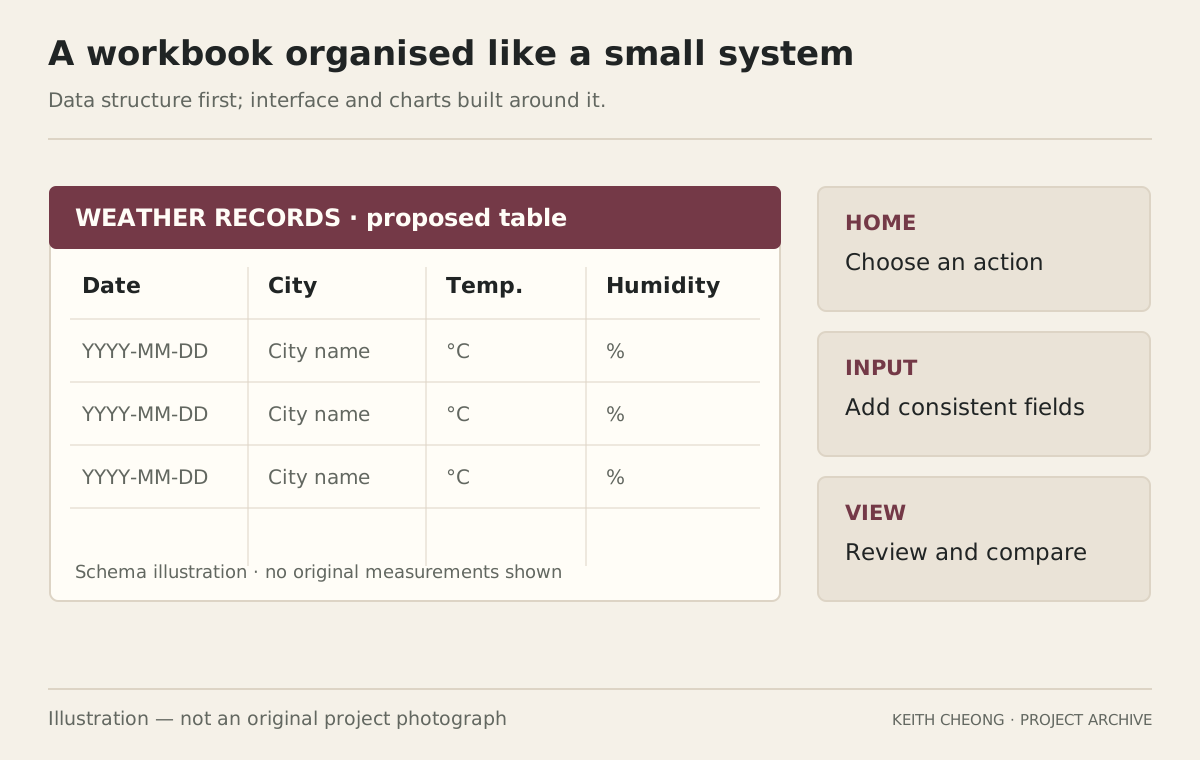
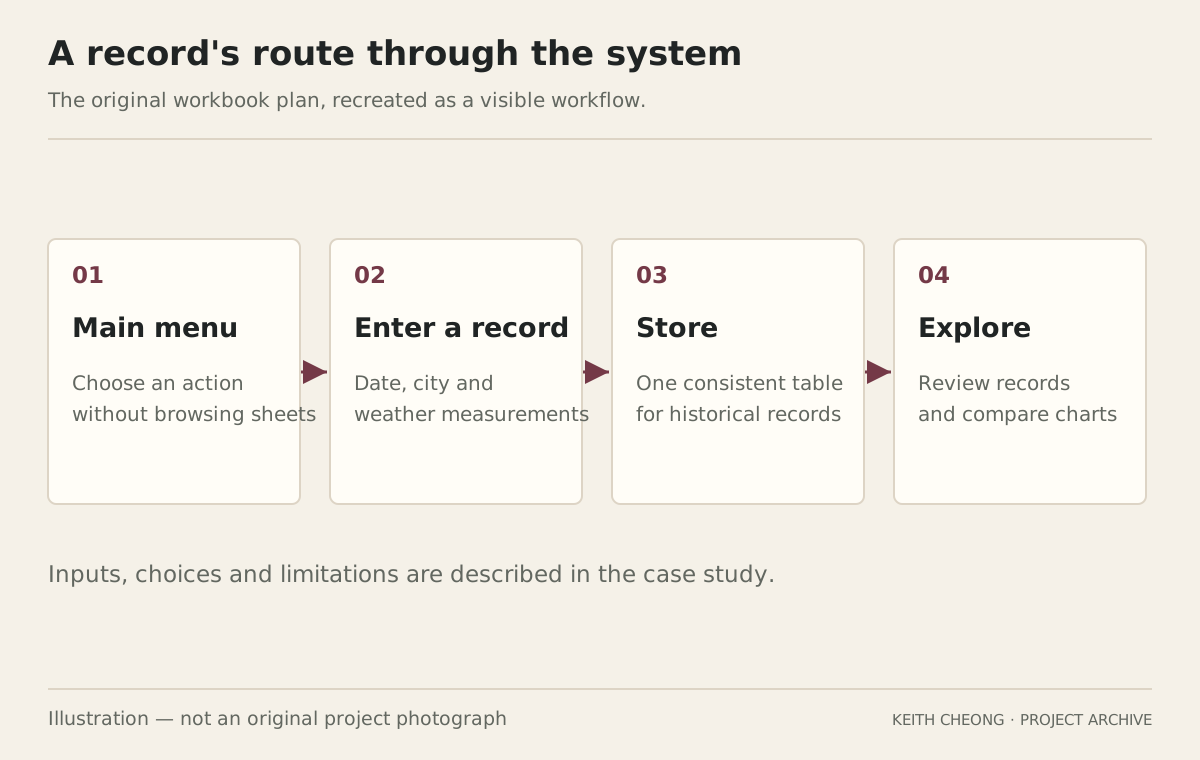
The idea was to organise weather information behind a simple menu. A user could choose to add a record or view existing data, rather than having to understand every worksheet at once.
The design separated entry, storage and analysis. Records belonged in a consistent table; charts and spreadsheet functions would turn that table into a view of changes over time.
02
The data structure
Each planned entry included a date, city, temperature, humidity and weather condition. Keeping the same fields across records was important for later filtering, comparison and charting.
Buttons were planned to connect the different views. I also considered a stable interface proportion so the workbook would remain readable while moving between screens.
03
Where the record stops
I researched VBA as a way to add new rows automatically. The available archive does not establish that a final macro-enabled workbook was completed, so this page describes the design work without claiming a finished VBA application.
The new browser demo is a separate implementation of that idea. Any example rows in a demonstration are sample records, not a historical weather dataset or a live forecast service.
04
What this project helped me practise
Define consistent fields before designing charts.
Separate data entry from storage and analysis.
Make navigation understandable to someone opening the workbook for the first time.
The original workbook plan, recreated as a visible workflow.Illustration — not an original project photograph
About this record
Source for project history: my supplied My Project Archive. No original XLSX/XLSM file or verified macro code is included in this reconstruction.
All diagrams on this page are newly made explanatory illustrations. They do not replace original photographs, test results or source files.